| Info |
|---|
In this tutorial, you will learn how to create a requirement submission form with ConfiForms add-on and further process the collected information with Table Filter and Charts add-on. As a product owner, you can use this tutorial to quickly collect requirements from stakeholders and then analyze them in Confluence. The tutorial will include the following steps:
In order to perform data filtration, aggregation, and visualization, you need to install Table Filter and Charts add-on. |
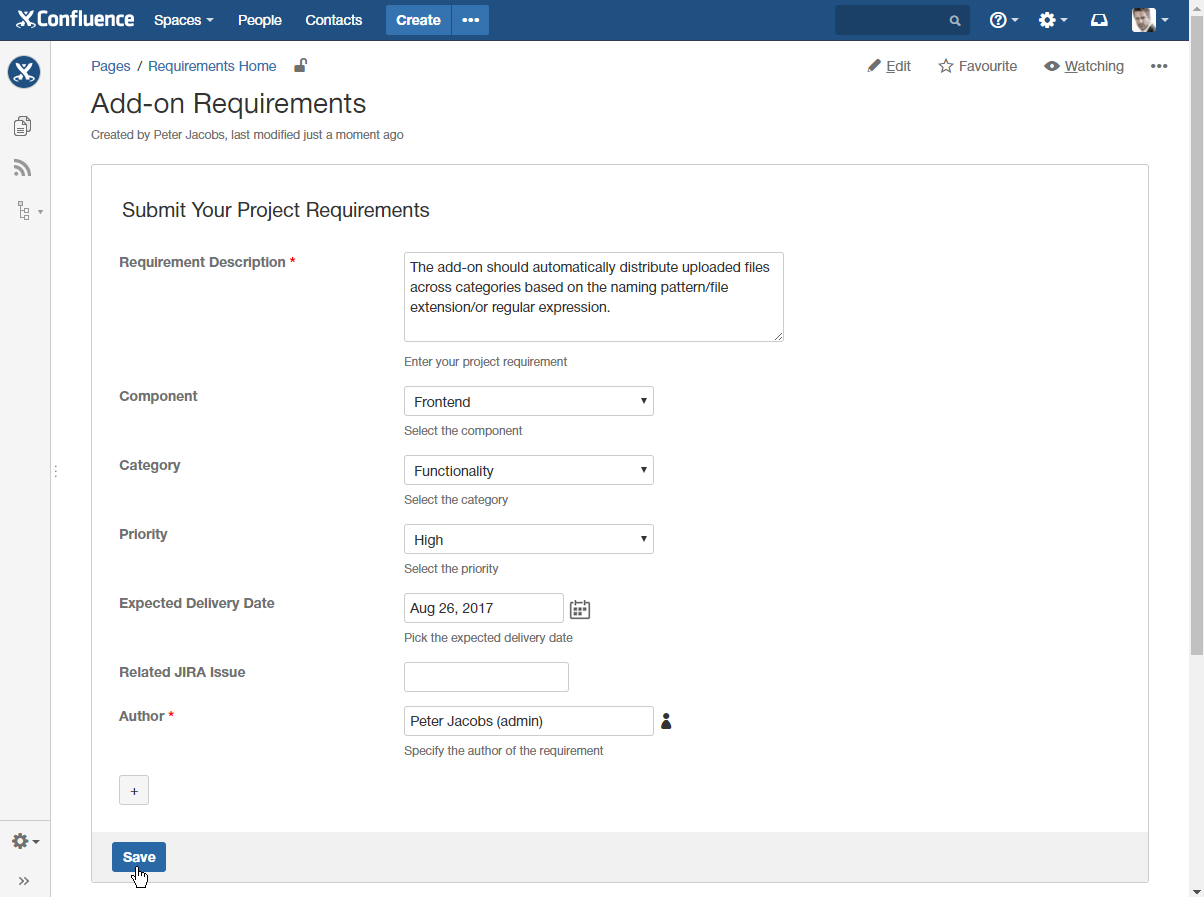
Creation of the requirement submission form
1. We start with a creation of the requirement submission form. We create a new page and insert the ConfiForms Form (Definition) macro here.
...
7. Share the page with stakeholders.
Collection of project requirements
1. Create a new page.
2. Insert the ConfiForms TableView macro. Specify the form name 'requirementSubmission' and the page where it is stored for pulling the collected data from.
...
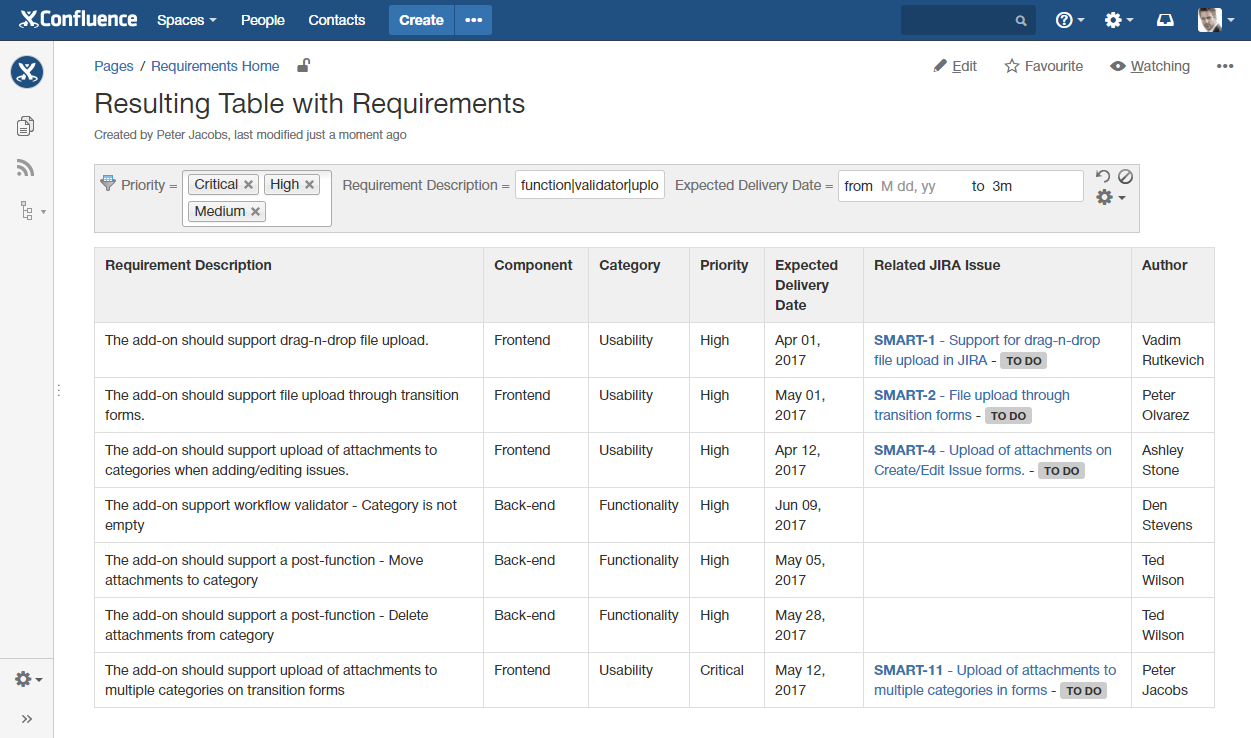
5. Save the page. As the result you will get a table with all requirements collected from stakeholders.
Filtration of project requirements
| Info |
|---|
For filtering the table with collected requirements we will use the Table Filter macro from Table Filter and Charts add-on. |
...
- filter requirements by priority (Critical, High, and Medium);
- enter the regular expression 'function|validator|upload' to look up for requirements containing any of these words;
- filter requirements which delivery date is expected in the nearest 3 month by entering the dynamic time query '3m'.
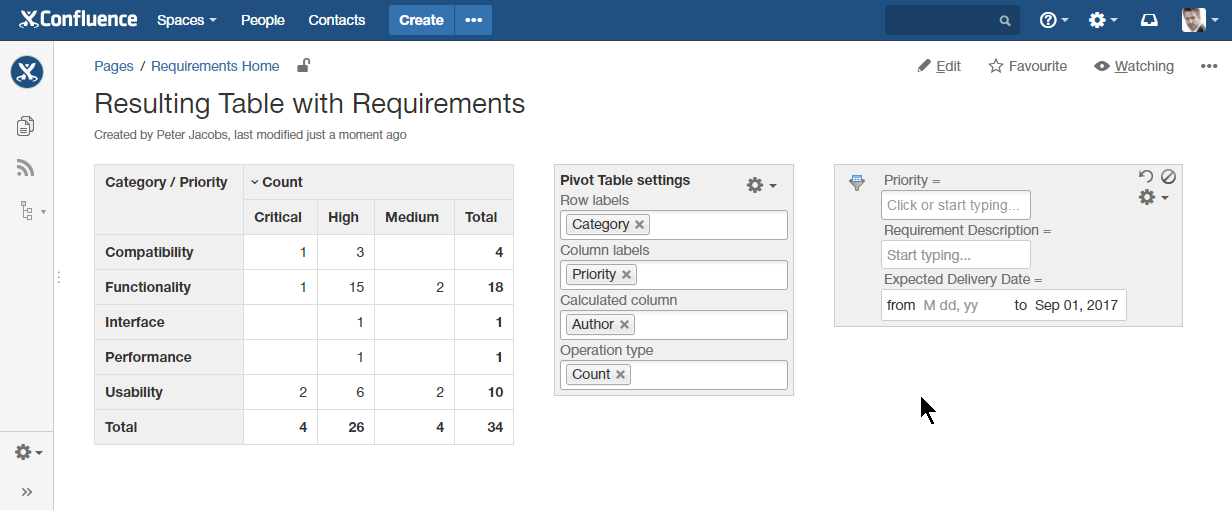
Aggregation of requirements against specific criteria
| Info |
|---|
For filtering the table with collected requirements we will use the Pivot Table macro from Table Filter and Charts add-on. It allows you to create multi-dimensional pivot tables for summarizing table data in Confluence. |
...
5. You can apply some filtration criteria to get the refined results.
Visualization of table with aggregated project requirements
| Info |
|---|
For visualizing the table with aggregated data we will use the Chart from Table macro from Table Filter and Charts add-on. |
...