We will start with configuration of the datasource (connection to database)
To make things simpler, we will use the same database used by Confluence, using the same database driver.
However, ConfiDoc can connect and show the data from any database, as long as you provide the database driver, have network access to that database from your Confluence server and provide correct connection details.
- Database connection setup for ConfiDoc
- Using this connection to show the data on Confluence page
- as table
- as list (with very custom layout)
- Making sure the connection usage is restricted to be used by Confluence admins only (the results will be shown to any user who has permissions to view the page where results are shown)
Let's start with #1
Connections to any sources (with ConfiDoc) are configured by Confluence admins. This is to enable single point of control and awareness of the systems integrated trhough ConfiDoc into Confluence.
Confligration UI is accessible thorugh the Settings-Add-ons menu (right upper corner)
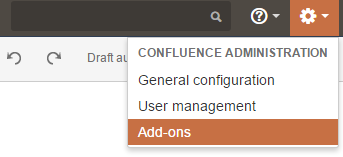
And then looking into ConfiDoc add-on listing
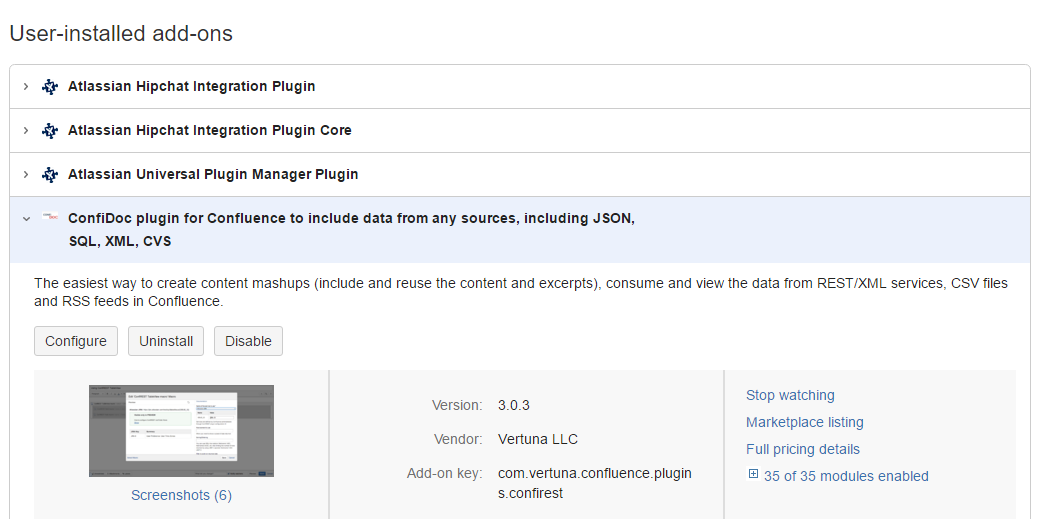
And clicking on "Configure" button. You will be directed to the URL, similar to this
https://YOURSERVER/admin/vertuna/confidoc/config.action
Click on "Add Configuration" button and choose "Database connection" as connection type
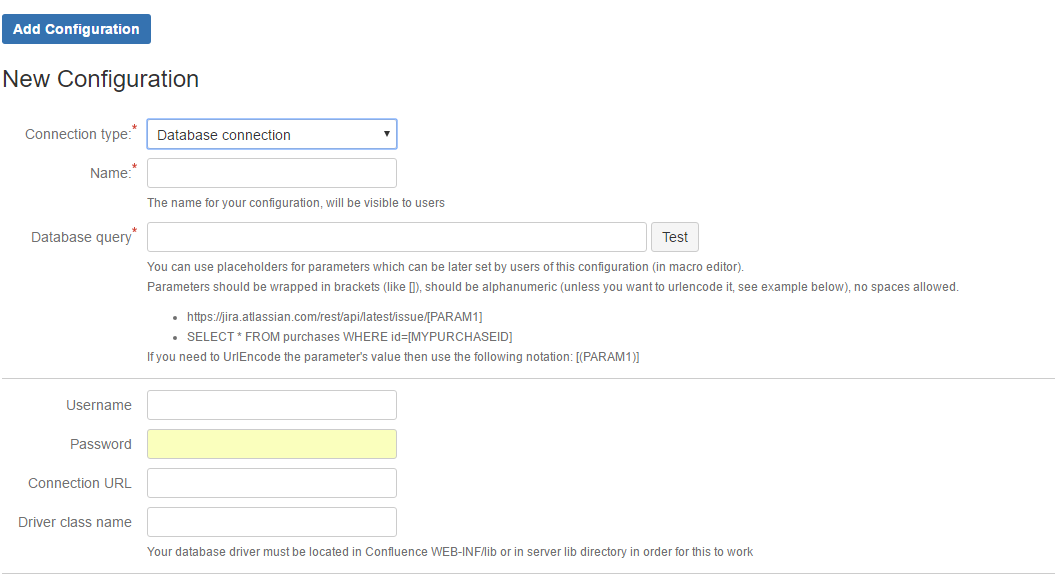
You will need to type some technical details in here, and a SQL query which you want tio use with this connection/configuration
Important bit is that if you connect to external database you will need to place a JDBC database driver to your database into Confluence installation directory under WEB-INF/lib or even into shared libraries to avoid classloading issues
Here is what we have configured in this tutorial:

You can use "Test" button to test the connection (access, authorization) and permissions (database permissions in this case)
Click, "Save" and we are done with configuration
Now we can move on to #2 and create some views over the data
Here is the live data from this configuration:
as Table (ConfiDoc TableView)
Name Link ConfiForms add-on for Confluence https://marketplace.atlassian.com/plugins/com.vertuna.confluence.plugins.confiform/server/overview Smart Templates & Pages nice app https://marketplace.atlassian.com/plugins/com.vertuna.confluence.plugins.smart-templates/cloud/overview ConfiDoc add-on for Confluence https://marketplace.atlassian.com/plugins/com.vertuna.confluence.plugins.confirest/server/overview as List
ConfiForms add-on for Confluence
Smart Templates & Pages nice app
ConfiDoc add-on for Confluence